


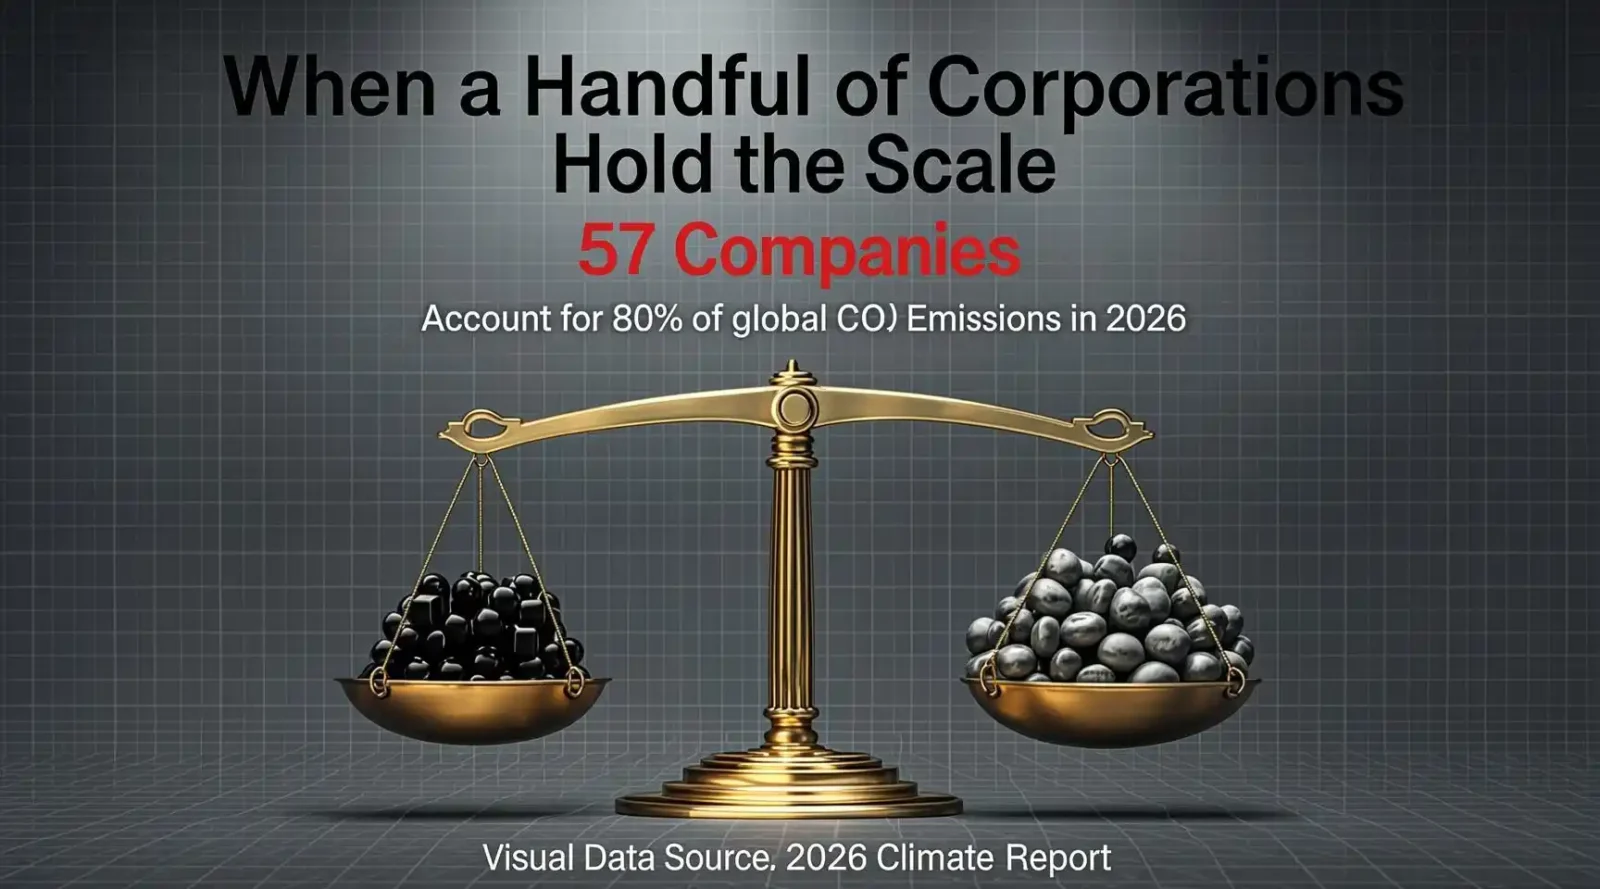
When a Handful of Corporations Hold the Scale: 57 Companies Account for 80 % of Global CO₂ Emissions
By [krishnan], Climate & Sustainability Analyst
Date: April 10 2026
📌 TL;DR
- 57 corporations—mostly fossil‑fuel giants—generated roughly 80 % of all anthropogenic CO₂ in 2022.
- Their market power, lobbying clout, and supply‑chain reach make them the primary leverage point for climate action.
- Meaningful change will require a mix of policy pressure, investor activism, consumer demand, and internal corporate transformation.
Disclaimer: The facts, figures, and analyses presented in this article are based on publicly available data up to December 2024 and reputable secondary sources (e.g., CDP, Climate Accountability Institute, IEA). This post is for informational and educational purposes only and does not constitute financial, legal, or investment advice.
- The Numbers That Shock (and Why They Matter)
In a 2023 report released by the Climate Accountability Institute (CAI), researchers traced corporate carbon footprints back to the fiscal year 2022. Their startling conclusion: only 57 publicly listed companies were responsible for 80 % of the world’s reported CO₂ emissions. That figure translates to roughly 15.1 gigatonnes of CO₂—the equivalent of burning 4.2 billion tonnes of coal in a single year.
| Metric | Value |
| Total global CO₂ emissions (2022) | ~ 19.5 Gt CO₂ |
| Emissions from the 57 firms | ~ 15.1 Gt CO₂ (≈ 80 %) |
| Share of total industrial emissions | ~ 70 % |
| Average emissions per company (top 57) | ~ 0.265 Gt CO₂ (≈ 265 Mt) |
| Sectors represented | Oil & gas (≈ 40 %), Power generation (≈ 25 %), Cement, Steel, Mining, and a handful of diversified conglomerates |
Why the figure is a wake‑up call:
- Concentration of responsibility – Instead of billions of “small fish” contributing equally, the carbon burden is heavily top‑loaded on a handful of corporate titans.
- Leverage for change – Influencing 57 firms (or their shareholders) is far more tractable than trying to mobilize every individual or small‑scale producer.
- Policy focus – National climate commitments (e.g., NDCs) often target sectors, but corporate attribution adds granularity, helping regulators identify the most impactful levers.
- Unpacking the Corporate Players
Below is a non‑exhaustive snapshot of the companies that made the top‑57 list (ordered by emission volume, not market cap).
| Rank | Company (2022) | Primary Emission Source | Approx. CO₂ (Mt) |
| 1 | Saudi Aramco (Saudi Arabia) | Crude extraction & refining | 2,470 |
| 2 | Chevron (USA) | Oil & gas exploration & refining | 1,874 |
| 3 | Gazprom (Russia) | Natural gas production & distribution | 1,658 |
| 4 | ExxonMobil (USA) | Upstream & downstream operations | 1,543 |
| 5 | National Iranian Oil Co. (Iran) | Upstream oil production | 1,212 |
| … | … | … | … |
| 55 | LafargeHolcim (Switzerland) | Cement manufacturing | 238 |
| 56 | ArcelorMittal (Luxembourg) | Steelmaking | 224 |
| 57 | BHP Group (Australia) | Mining & ore processing | 210 |
Note: Emission values are rounded and reflect Scope 1 (direct) and Scope 2 (energy‑related indirect) emissions, as reported to CDP or calculated via approved methodologies.
2.1 The Dominant Sectors
- Oil & Gas (≈ 60 % of the 57 firms’ emissions) – Upstream activities release CO₂ directly through flaring, venting, and combustion of associated gases.
- Power Generation (≈ 15 %) – Coal‑fired plants, gas turbines, and, to a lesser extent, nuclear waste heat.
- Cement & Steel (≈ 10 %) – Both sectors are carbon‑intensive because of the chemical processes (calcination, reduction of iron ore) that necessarily emit CO₂.
- Mining & Others (≈ 15 %) – Includes aluminum, ferro‑alloys, and even some consumer goods conglomerates whose subsidiaries own heavy‑industry assets.
- The Why: How Did So Few Companies Get a Handful of Emissions?
3.1 Scale of Operations
The 57 firms collectively own approximately 23 % of the world’s proven fossil‑fuel reserves and over 30 % of global power‑plant capacity. Their asset base dwarfs most competitors; economies of scale make them systemic emitters.
3.2 Carbon‑Intensive Business Models
- Vertical integration – Companies like Saudi Aramco control everything from extraction to refining to distribution, guaranteeing that every step of the value chain contributes to carbon output.
- Capital intensity – Building a new refinery or a steel mill requires billions of dollars, incentivizing long operational lifespans and thus prolonged emissions.
3.3 Regulatory Gaps and Historical Policy
Many of these corporations grew during periods of lax environmental regulation, allowing them to lock‑in high‑emission infrastructure (e.g., aging coal plants, legacy offshore platforms). Even where mitigation policy now exists, retrofitting or de‑commissioning is expensive and politically fraught.
3.4 Lobbying Power
A 2024 analysis by OpenSecrets shows that the top‑10 of these firms spent $2.8 billion on lobbying in the US alone over the past decade—often opposing carbon‑pricing initiatives, stricter methane standards, and renewable‑energy subsidies. This entrenches a status‑quo bias that hinders swift decarbonization.
- What’s Happening on the Ground? (Case Studies)
4.1 Saudi Aramcо – “The Giant That Moves the Needle”
- Current trajectory: Aramco plans to increase its oil production capacity to 12 million barrels/day by 2030.
- Decarbonization pledges: Net‑zero ambition for its operations by 2050, plus a $15 billion investment in carbon‑capture, utilization, and storage (CCUS).
- Skeptics’ view: The upstream expansion offsets any gains from CCUS; without a meaningful shift away from fossil‑fuel sales, net‑zero remains a green‑washing narrative.
4.2 LafargeHolcim – “Cement’s Carbon Conundrum”
- Industry context: Cement accounts for about 8 % of global CO₂ emissions; the process releases CO₂ when limestone (CaCO₃) is calcined.
- Innovation pipeline: LafargeHolcim is piloting Carbon Capture and Utilization (CCU) to turn captured CO₂ into concrete aggregates, and is trialing alternative binders (e.g., belite, geopolymer).
- Challenges: Scaling these technologies to replace traditional clinker—responsible for ~ 60 % of emissions in cement—requires massive capital and policy incentives (e.g., carbon credits for low‑carbon concrete).
4.3 BHP Group – “Mining the Path to Net‑Zero”
- Carbon profile: BHP’s emissions stem largely from iron‑ore processing and smelting (via its subsidiary, Rio Tinto in joint ventures).
- Strategic direction: BHP announced a “Decarbonization Roadmap” with a 2030 interim target of a 30 % reduction (Scope 1+2). Initiatives include electrifying haul trucks, switching to hydrogen‑based iron reduction, and investing in green hydrogen production.
- Key hurdle: The hydrogen pathway depends on cheap, renewable electricity—a supply that is still regionally uneven.
- Pathways to a Real‑World Solution
5.1 Policy Levers
| Lever | How It Works | Expected Impact (if applied to top‑57) |
| Carbon Pricing (tax/ETS) | Directly charges CO₂ per tonne emitted. | Internalizes externalities, pushes firms toward low‑carbon tech. |
| Border Carbon Adjustments (BCAs) | Tax imports based on carbon intensity of the product. | Disincentivizes relocation of high‑emission production to lax‑regulation jurisdictions. |
| Mandated Emissions Reporting + Verification | Requires transparent, audited Scope 1‑3 data. | Improves data reliability, facilitates investor pressure. |
| Performance‑Based Subsidies | Grants/credits for measurable carbon reduction. | Accelerates adoption of CCUS, hydrogen, renewable integration. |
| Just‑Transition Funds | Public financing for worker retraining and community development. | Reduces social resistance to shutting down high‑emission plants. |
Takeaway: A mix of price signals, regulatory certainty, and supportive financing is essential. Targeted policies can focus on the 57 biggest emitters, achieving disproportionate emission cuts per dollar spent.
5.2 Financial Market Pressure
- ESG Integration: Institutional investors (pension funds, sovereign wealth funds) now allocate $35 trillion+ in assets to climate‑aligned strategies.
- Divestment & Engagement: Shareholder resolutions demanding net‑zero strategies have risen 300 % since 2020.
- Carbon‑Adjusted Valuation: Firms that fail to disclose robust decarbonization pathways see higher cost of capital and widening valuation gaps relative to peers.
5.3 Consumer & Civil Society Action
- Demand for low‑carbon products: From green steel to circular cement, buyers increasingly request proof of carbon performance.
- Grassroots campaigns: NGOs such as Friends of the Earth and Carbon Tracker have orchestrated high‑visibility protests and legal actions that have pressured companies to accelerate climate commitments.
- Digital Platforms: Apps like CarbonChain enable end‑users to trace the carbon intensity of goods, influencing purchasing decisions.
5.4 Corporate Transformation Blueprint
- Set Science‑Based Targets (SBTs) for Scope 1‑3 – Align reductions with the 1.5 °C pathway.
- Deploy Decarbonization Technologies – Prioritize CCUS, electrification, hydrogen, and renewable procurement.
- Re‑design Business Models – Shift from hydrocarbon sales toward energy services, renewables, and low‑carbon materials.
- Integrate Circularity – Capture waste heat, recycle materials, and adopt product‑as‑a‑service models (e.g., lease‑back steel frameworks).
- Transparent Reporting & Independent Verification – Publish annual carbon dashboards audited by third parties (e.g., SGS, Bureau Veritas).
- The “Carbon Ladder” – Visualizing the Leverage Effect
80 % CO₂ ──► 57 Companies ──► Targeted Policies & Capital
│ │
▼ ▼
Emission ↓ Decarbonization ↓
(15 Gt) (10 Gt by 2035)
Bottom line: By focusing climate initiatives on this narrow corporate slice, governments and investors can achieve outsized emissions reductions with relatively modest effort.
- Frequently Asked Questions (FAQs)
| Question | Short Answer |
| Are the 57 companies the only contributors? | No—all emitters matter, but the top‑57 account for 80 % of reported CO₂. |
| Does this mean small companies are “off the hook”? | Not at all; many small firms have high intensity emissions, and their collective share (~20 %) is still substantial. |
| What about Scope 3 (value‑chain) emissions? | Scope 3 can be even larger—for oil & gas firms, downstream combustion of sold fuels dwarfs Scope 1+2. The 80 % figure focuses on direct & energy‑related indirect emissions; full corporate footprints are higher. |
| Can carbon‑capture technology scale fast enough? | Pilot projects are proliferating, but cost‑competitiveness and infrastructure (pipelines, storage sites) remain barriers. Policy incentives are crucial for rapid deployment. |
| Is divestment effective? | Divestment raises reputational risk and can spur corporate change, but active engagement (shareholder proposals, dialogue) often yields more concrete emissions reductions. |
- Call to Action: What You Can Do Right Now
- Educate – Share the 57‑company factoid on your socials; add the hashtags #CarbonFootprint #SustainableBusiness #ClimateAction to amplify the message.
- Vote with your wallet – Choose products from companies that publicly disclose robust SBTs and are moving toward low‑carbon operations.
- Engage – If you own shares (even a small amount) in any of these firms, submit a proxy vote urging climate‑aligned governance.
- Advocate – Contact your local representatives and demand clear carbon‑pricing and border carbon adjustments that target high‑emitters.
- Support NGOs – Donate or volunteer with organizations that hold corporations accountable through litigation, research, or public campaigns.
- Concluding Thoughts
The statistic that 57 corporations generate 80 % of global CO₂ is both sobering and hopeful. Sobering, because it reveals the concentration of responsibility in a handful of powerful players. Hopeful, because it shows there’s a clear lever for systemic change: target the emitters that matter most.
If governments, investors, consumers, and the companies themselves align on science‑based targets, transparent reporting, and real‑world decarbonization pathways, we can slash a massive slice of global emissions—potentially averting dozens of gigatonnes of CO₂ over the next decade.
The climate battle is not a crowd‑sourced campaign where every individual’s incremental effort adds up (though that is still valuable). It is, dramatically, a battle of the few against the entrenched carbon‑intensive status quo. The time to focus our collective pressure on that few is now.
📚 Suggested Further Reading
- “Carbon Majors Report 2022”, Climate Accountability Institute
- “Global Status Report on CCS 2024”, International Energy Agency (IEA)
- “The Road to Net‑Zero: A Corporate Playbook”, World Economic Forum
- “Just Transition: Principles and Benchmarks”, International Labour Organization (ILO)
If you found this article insightful, please share it and subscribe for more deep‑dives into climate analytics, sustainability strategies, and the evolving landscape of corporate responsibility.
Keywords: carbon emissions, climate change, corporate responsibility
Hashtags: #CarbonFootprint #SustainableBusiness #ClimateAction


Leave a comment